 Want a simple, clear way to present hierarchical data? Try a d3 Sunburst.
This is a detailed walk-through of a simple-ish d3 Sunburst. I explain a lot of the details about svg, javascript, and d3. Skip what you don’t need. We’ll avoid advanced features today, but end up with a functional sunburst in only 54 lines of code. It lays the groundwork for creating a labeled, interactive, hierarchical visual.
Just want the code? Or an overveiw of the tutorials?
I hope this tutorial helps you deepen your d3 visualization skills. If it does that, or if you have an idea about how to improve something below, let me know in the comments section. Do good!
—David Richards
Tutorial Contents
Don't know much about history
Don't know much biology
Don't know much about a science book,
Don't know much about the french I took...
–Sam Cooke, What A Wonderful World
- Summary
- The Web Page
- The Data
- Initialize Variables
- Set up our SVG workspace
- Layout the Data
- Calculate Each Arc
- Connect Layout & Data
- Update Pattern
Summary
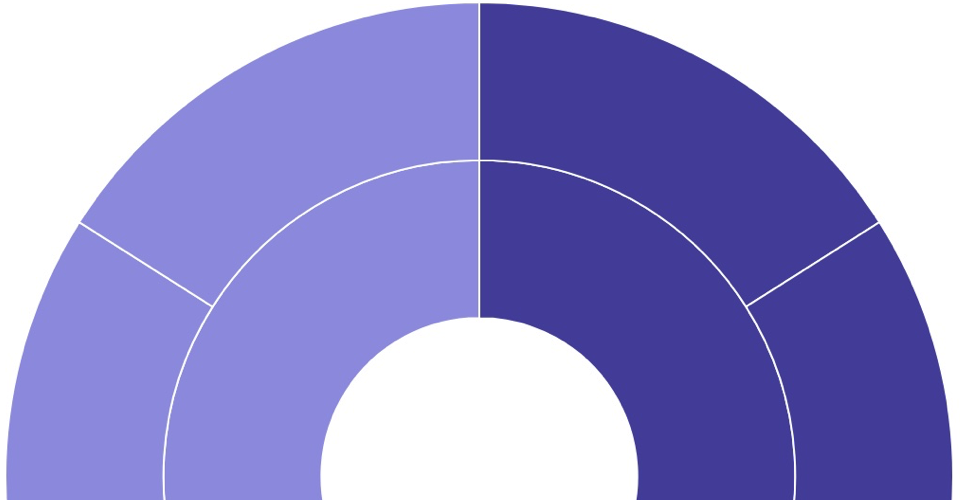
In this tutorial, we’ll build a super basic sunburst–No Frills, if you will. (Tips: Consider keeping the raw code open–link icon below–in a separate tab.)
| New: Sunburst in 54 Lines |
The Web Page
Let’s create a bare-bones web page that references the d3 framework and holds our sunburst viz.
<head>
    <script src='https://d3js.org/d3.v4.min.js'></script>
</head>
<body>
    <svg></svg>
</body>
<script>
    <!-- d3 logic goodness here -->
</script>
This very basic web page has includes 2 <script> sections
- The
<head>points the browser to our d3 library (This tutorial references the master version of d3. However, I usually reference a local copy–there’s nothing sadder than a broken sunburst due to a d3 update). - The
<body>will hold all of the code that actually builds our sunburst, code that is shared below.
The <body> section also contains a <svg> element. This is where our d3 visualization will actually get drawn.
Initialize Variables
We’ll set variables for common values here at the top.
var vWidth = 300;  // <-- 1
var vHeight = 300;
var vRadius = Math.min(vWidth, vHeight) / 2;  // < -- 2
var vColor = d3.scaleOrdinal(d3.schemeCategory20b);   // <-- 3
We’ll set 4 variables that we can use throughout our code. I begin each variable name with a lower-case v (for “visualization”). It will to clarify the difference between our locally set variables and official language commands or settings (which often use these same terms).
-
var vWidth = 300creates a variable set to 300; it does not actually set the width of anything, yet. Below we’ll apply this variable to the<svg>element’s width attribute. We could set width directly in html (<svg width=300>). But we’ll use this values a few times. If we coded it directly, we’d then need to change each occurrences every time. Mistakes will happen. -
var vRadius = Math.min(vWidth, vHeight) / 2determines which is smaller (Math.min), the width or vHeight. Then it divides that value by 2 (since the radius is 1/2 of the circle’s diameter). Then we store that value as our radius. This optimizes the size of our viz within the<svg>element (since we don’t want to leak past the edges, but we also don’t want a bunch of wasted white space). Since width and height are both 300, the vRadius variable will equal 150. -
d3.scaleOrdinal: d3 scales help us map our data to something in our visual. (Read the docs for more.)- Outside of d3, ordinal scales indicate the direction of the underlying data and provide nominal information (e.g., low, medium, high). In the same way, scaleOrdinal in d3 allows us to relate a part of our data to something that has a series of named values (like an array of colors).
schemeCategory20bis a d3 name that returns a built in array of colors. d3 has several similar options that are specifically designed to work withd3.scaleOrdinal(). The result of this line is that we’ll have a variable (‘vColor’) that will return a rainbow of options for our sunburst.
The Data
We create data to be presented in our sunburst.
var vData = {
    'id': 'TOPICS', 'children': [{
        'id': 'Topic A',
        'children': [{'id': 'Sub A1', 'size': 4}, {'id': 'Sub A2', 'size': 4}]
    }, {
        'id': 'Topic B',
        'children': [{'id': 'Sub B1', 'size': 3}, {'id': 'Sub B2', 'size': 3},
	        {'id': 'Sub B3', 'size': 3}]
    }, {
        'id': 'Topic C',
        'children': [{'id': 'Sub A1', 'size': 4}, {'id': 'Sub A2', 'size': 4}]
    }]
};
JSON data for a sunburst should be structured as a hierarchy. This JSON contains data for 11 nodes. (We may call them arcs when we calculate each node’s size in d3 code. And we may call them slices when we’re looking at our visualization.). The very first node is called the root node (in our code above: 'id': 'TOPICS'). The root node is critical for hierarchical visualizations. And there can only be one root. It’s a sort of anchor for our data and visualization; and we often treat it differently since it’s the center of our sunburst. In the data above, we define each node in 1 of 2 ways:
-
{'id': 'abc', 'children': []}describes a node that has children. Size isn’t defined for these nodes, because that will be calculated by d3 based on that node’s children (e.g., if a node has 2 children of size 3 and size 5, it will have a size of 8). Children nodes can be more nodes like this one, with children of their own, or nodes that have a ‘size’, but no children. -
{'id': 'xyz', 'size': 4}describes a node with no children of its own. The hierarchy does not need to be symmetrical. Nodes can have differing numbers of children, or have ‘sibling’ nodes that have no children at all).
(NOTE: We’ve made some simplifying rules for this tutorial that won’t always hold true.)
Set up our SVG Workspace
Begin by getting a handle on our SVG and beginning to get things set up.
var g = d3.select('svg')  // <-- 1
    .attr('width', vWidth)  // <-- 2
    .attr('height', vHeight)
    .append('g')  // <-- 3
    .attr('transform',
        'translate(' + vWidth / 2 + ',' + vHeight / 2 + ')');  // <-- 4
-
d3.select('svg')selects our<svg></svg>element so that we can work with it. Thed3.select()command finds the first element (and only the first, if there are multiple) that matches the specified string. If the select command does not find a match, it returns an empty selection. -
.attr('width', vWidth)sets the width attribute of our<svg>element (as if we’d written<svg width='300'>in our html section. .append('g')adds a<g>element to our SVG.- If you’re new to SVG, the
<g>element can be a bit confusing. It does not do much directly. Instead, it’s is a special SVG element that acts as a container; it groups other SVG elements. Think of it as a basket to hold the stuff your really care about. - The transformations that we apply to this
<g>element are performed on all of its child elements. And its attributes are inherited by its children. That’ll be helpful later.
- If you’re new to SVG, the
.attr('transform', 'translate(' + vWidth / 2 + ',' + vHeight / 2 + ')')translates to.attr('transform', 'translate(150,150)'). This command moves the center of our coordinate system (for<g>) 150 units right (x-axis) and 150 units down (y-axis).- Going a bit deeper: This command sets the value for the
transformattribute (as we did withwidthabove). SVG’stransformattribute allows us to scale, move (“translate”), or rotate our<g>element (and it’s children). There’s a longer conversation to be had about the SVG coordinate system (Sara Soueidan’s article helps clarify the mechanics). For now, we’ll simply say that we’ll use this transform attribute to move the ‘center’ [0,0] of our<g>element from the upper-left to the center of our 300 by 300<svg>space.
- Going a bit deeper: This command sets the value for the
The var g = allows us select this particular <g> element later in our code, using the variable g. See Method Chaining below for an explanation.
Method Chaining & the HTML
Method chaining allows us to connect multiple commands together with periods between into a single statement, like we’ve done above. It’s important to recognize that each command does it’s thing then returns something. The next command (method) in the chain applies to that something that was returned. Here’s the above code, with a note about what each line returns:
var g = d3.select('svg')  // returns a handle to the <svg> element
    .attr('width', vWidth)  // sets the width of <svg> and then returns the <svg> element again
    .attr('height', vHeight)  // (same as width)
    .append('g')  // adds a <g> element to the <svg> element, and returns the <g> element
    .attr('transform',
        'translate(' + vWidth / 2 + ',' + vHeight / 2 + ')');
        // takes the <g> element and moves the [0,0] center over and down; returns the <g> element
Method chaining is key to understanding what’s going on in most all d3 code. To fully ‘get’ the meaning of a code block, we must understand both what the method does and what each part returns. (Want more? See Scott Murray’s Chaining methods article.)
Another way to think about the progression of our d3 is to see our html elements grow through each step. Thinking about the same 1-5 steps above, we’d see the following happen:
var g = d3.select('svg')  // --> <svg></svg>
    .attr('width', vWidth)  // --> <svg width='300'></svg>
    .attr('height', vHeight)  // --> <svg width='300' height='300'></svg>
    .append('g')  // --> <svg width='300' height='300'><g></g></svg>
    .attr('transform',
        'translate(' + vWidth / 2 + ',' + vHeight / 2 + ')');
        // --> <svg width='300' height='300'><g transform='translate(150,150)'></g></svg>
Layout the Data
We prepped our SVG above, now we’ll lay out our data for our data for our sunburst.
Conceptually, imagine you’re an artist preparing to create a masterpiece. You might begin by prepping your physical space: easel, canvas, etc. That’s our SVG. Then you’d organize your thoughts around the type of painting you intended to draw. For a portrait, you’d plan for the subject and their background; for a landscape, you might organize your thoughts around a foreground scene and sky and some focal-point. These lines of code are analogous to your planning step.
var vLayout = d3.partition()  // <-- 1
    .size([2 * Math.PI, vRadius]);  // <-- 2
- The
partitioncommand will organize our data into the sunburst pattern. It begins the process of ensuring that the parts of layout are properly sized (e.g., that we use all 360 degrees of the circle, and that each slice is sized relative to the other slices).- d3 has other layout commands for alternate hierarchical patterns like trees and treemaps.
- NOTE: This is about structure only, since we haven’t linked it to our data yet.
sizesets this partition’s overall size ‘width’ and ‘height’. But we’ve shifted from an [x,y] coordinate system (where a box could be 25 by 25] to a system where we size each part of our sunburst in radians (how much of the 360 degrees the shape will consume) and depth (distance from center to full radius):2 * Math.PItells d3 the number of radians our sunburst will consume. Remember from middle-school geometry that a circle has a circumference of 2πr (2 * PI * r). This calculation tells d3 how big our sunburst is in ‘radiuses’. The answer is that it’s 2π radiuses (or radians). So it’s a full circle.- Want a sunburst that’s a ½ circle? Delete the
2 *. - Want to better understand radians and how they map to degrees? Try mathsisfun: radians or Intuitive Guide to Angles, Degrees and Radians.
- Want a sunburst that’s a ½ circle? Delete the
vRadiustakes our variable, set above, and tells d3 that this is the distance from the center to the outside of the sunburst.
Calculate Each Arc
Now that we’ve planned for the layout of our data to our sunburst pattern, we need a way to calculate the size of each arc (aka, node, slice) within our sunburst. The code below tells d3 how to perform this calculation when it’s ready.
var vArc = d3.arc()
    .startAngle(function (d) { return d.x0 })
    .endAngle(function (d) { return d.x1 })
    .innerRadius(function (d) { return d.y0 })
    .outerRadius(function (d) { return d.y1 });
d3.arc() calculates the size of each arc based on our JSON data. Each of the 4 variables below are staples in d3 sunbursts. They define the 4 outside lines for each arc.
- d.x0 is the radian location (think of this as the beginning spoke in a wheel) for the start of the arc, as we traverse around the circle.
- d.x1 is the radian location for the end of the arc (then this is the ending spoke). If x0 and x1 are the same, our arc will be invisible. If x0 = 0 and x1 = 2, our arc will encompass a bit less than 1/3 of our circle.
- d.y0 is the radius for the inside arc.
- d.y1 is the radius location for the outside arc. If y0 and y1 are the same, our arc will be invisible.
Connect Layout & Data
Now as the artist, prep is done and you’re ready to begin combining your canvas and ideas into one beautiful creation. These lines begin to mix the two.
var vRoot = d3.hierarchy(vData)  // <--1
    .sum(function (d) { return d.size });  <-- 2
var vNodes = vRoot.descendants();  // <--3
vLayout(vRoot);  // <--4
-
The sunburst layout (or any hierarchical layout in d3) needs a root node. Happily, our data is already in a hierarchical pattern and has a root node
('id' : 'TOPICS'). So we can pass our data directly to d3.partition with no preliminary reformatting. We used3.hierarchy(vData)to tell d3, ‘Hey d3, our data is stored in the vData variable. It’s already shaped in a hierarchy.’ sum()iterates through each node in our data and adds avalueattribute to each one. The value stored in thevalueattribute is the combined sum of oursizeattributes (since that’s what we’ve asked for). It’s based on the size of itself (if there’s asizeattribute for it in our vData and all of its child nodes. In a minute we’ll use this to determine arc / slice sizes.- Example: If the current node has no size attribute of its own, but it has 2 children, each size = 4, then
.sum()will create avalue = 8attribute for this node. - See the d3 documentation for node.sum(value)
- Example: If the current node has no size attribute of its own, but it has 2 children, each size = 4, then
-
var vNodes = vRoot.descendants()tells d3 which elements ofvRootthat we want to show in our sunburst. It’s not doing any real work yet; but creating this variable now will simplify some of the code below. vLayout(vRoot)combines our d3.partition variable above (which creates the data structure) with the actual data. This line sets us up for the arc statement.- NOTE: It’s useful to inspect our variables within the browser using breakpoints and watches (think Chrome or Firefox). Inspecting ‘d’ in our functions (e.g.,
function (d) { return d.x0 }) before and after this partition line yields an interesting finding: - Before this line, ‘d’ for a particular node returns an simple object that looks just like our underlying JSON:
{name: 'Sub A1', size: 4}. - After this partition line, ‘d’ for a particular node returns a d3-shaped object:
{data: Object, height: 0, depth: 2, parent: qo, value: 4…}. And our JSON attributes are tucked into the data attribute.
- NOTE: It’s useful to inspect our variables within the browser using breakpoints and watches (think Chrome or Firefox). Inspecting ‘d’ in our functions (e.g.,
The d3 function(d) Pattern
d3 has a specific pattern for retrieving your data and applying it to d3 commands, a pattern that you’ll see repeatedly:
function(d) { return d }. This functions accepts ‘d’, which represents your data, and returns a value, or an array of values, based on your data. The ‘return d’ part can get intricate. In our code, we’re returning the size (d.size) to the sum function. We defined ‘size’ in our JSON, so it’s often available for a node. When size isn’t defined, this function returns 0. Two specific examples from our data:
- ‘Sub A1’ will have a has a size of 4.
- ‘Topic A’ has a size of 8, the sum of ‘Sub A1’ and ‘Sub A2’.
- d is a positional argument here, so it could be named anything. In fact, your code may be clearer if you give it a more descriptive name (that will then be used within the body of this function).
- There are additional positional arguments that can be used within this functional statement. We’ll save those for later.
Update Pattern
d3’s ‘update pattern’ is central to most visualizations. It’s the process of adding each node to our physical space.
var vSlices = g.selectAll('path') // <-- 1
    .data(vNodes)  // <-- 2
    .enter()  // <-- 3
    .append('path'); // <-- 4
Let’s walk through a basic application of the update pattern:
-
g.selectAll('path')starts with the g variable that we created way above; it references the<g>element that we originally appended to our<svg>element.selectAllgets a reference to all existing<path>elements within our<g>element. ‘That’s odd,’ you say, ‘since we know that there are no<path>elements in<g>.’ You are right. They don’t exist, yet! For now, we’ll just say that d3 uses this step to establish where the new<path>elements will fit on the page (in the svg object model). -
.data(vNodes)tells d3 to use vNodes as our data, that we want to create<path>statements for each node. -
.enter()tells d3 to ‘connect’ the originally selected<path>element with our data so that we can… -
.append('path')actually creates one new, but empty,<path>element for each node under our<g>element.
See Chris Givens’ Update Pattern tutorial for another look at steps 1-4 above.
Now that we have our data expressed in our DOM (document object model), we’ll add some attributes to the new (empty) <path> elements so that they actually show up visibly on the screen. (Though you can see them using Chrome’s Developer tools now, if you run the code up through this point.)
Draw Our Sunburst
Now that we have one <path> element for each node, let’s add the attributes to that element so that we can see it on the page.
vSlices.filter(function(d) { return d.parent; })  // <-- 1
    .attr('d', vArc)  // <-- 2
    .style('stroke', '#fff')  // <-- 3
    .style('fill', function (d) {  // <-- 4
        return vColor((d.children ? d : d.parent).data.id); });
This final block of code takes everything we’ve built so far and writes it to our <svg><g></g></svg> element, using a series of <path> elements.
filter(function(d) { return d.parent; })returns eithertrueorfalsefor each node, depending on if the node has a parent. Only 1 node (the root does not have a parent). So the rest of the chained commands will work on all of the rest of the nodes (all except the root). The root node will have a<path>element, but that element won’t have any attributes, so we won’t see it on the screen–it’ll be invisible.attr('d', vArc)fills in all the ‘d’ attributes of each<path>element with the values from our arc variable. Two important notes here:- The
dattribute contains the actual directions for each line of this svg<path>element, see the example below. - Don’t confuse the the
<path d=''>attribute with the d variable that represents the nodes within or d3 script (when we use d to represent our nodes in d3, that’s by convention only; while the d in the path statement is the required attribute to tell path where to draw its lines).
- The
-
style('stroke', '#fff')addsstyle='stroke: rgb(255, 255, 255);'to our<path>element. Now the lines between our slices are white. In a future tutorial, we’ll color our stroke in the<style>block (aka, CSS) since it doesn’t require any run-time magic. style('fill', function (d) { return vColor((d.children ? d : d.parent).data.name); })combines thevColorvariable we defined at the beginning (which returns an array of colors that we can step through) with our data.(d.children ? d : d.parent)is a javascript inlineifin the form of (condition ? expr1 : expr2). It says: if the current node has children, return the current node, otherwise, return its parent.- That node’s name will be passed to our vColor variable and then returned to the style attribute within each
<path>element.
In the end, this section of our HTML will look something like this (ellipsis indicates details that I’ve omitted to keep this example block from growing too big):
<g transform='translate(150,150)'>
    <path display='none' d='. . .' style='stroke: rgb(255, 255, 255); fill: rgb(82, 84, 163);'>
    <path style='stroke: rgb(255, 255, 255); fill: rgb(82, 84, 163);' d='M1.020538999289461e-14,-166.66666666666666A166.66666666666666,166.66666666666666,0,0,1,
    150.80450874433657,70.96321526084546L75.40225437216829,35.48160763042273A83.33333333333333,83.33333333333333,
    0,0,0,5.102694996447305e-15,-83.33333333333333Z'>
    </path></path> . . . <path></path>
</g>
Voilà! Great job on creating your first, well-understood, hierarchical visualization in d3. We’ve just scratched the surface. If you’re ready, join me for Tutorial 2.
Or maybe we should kayak…
Independence Day evening with the family kayaking on the water to see fireworks.